From Raw Streams to Personal Stories: Building Spotify Wrapped Highlight Detection
Overview
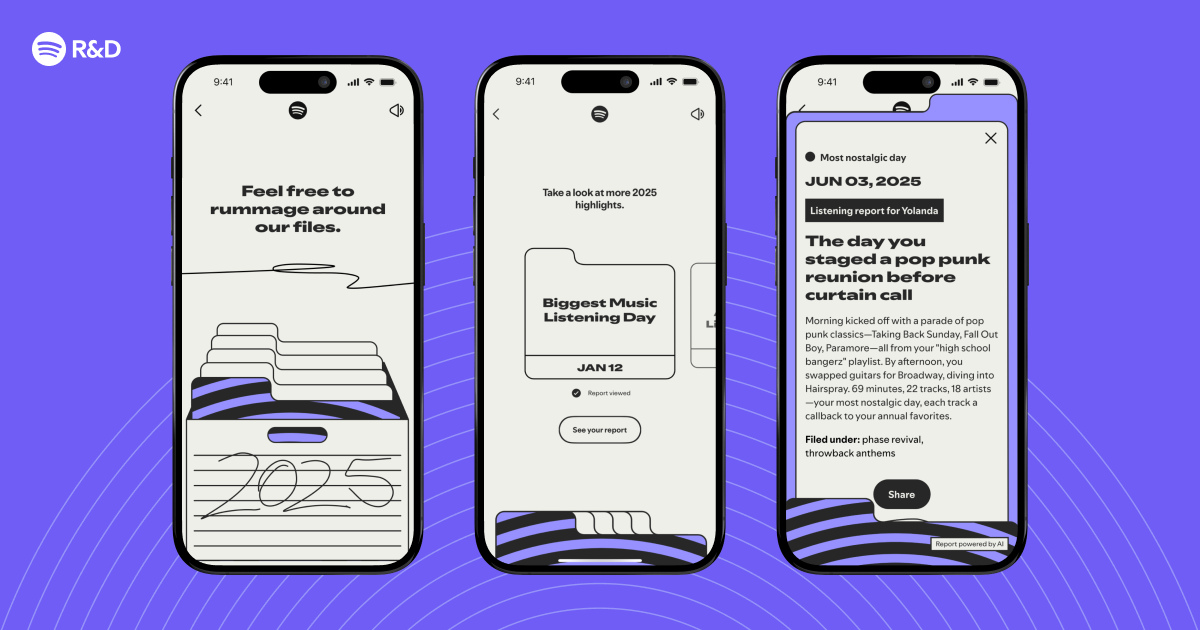
Each December, millions of Spotify users open their Wrapped summary to discover their top songs, artists, and genres. But what about the unexpected moments—the song that became an instant anthem, the midnight playlist, or the artist you discovered on a rainy Tuesday? The 2025 Wrapped introduced “Highlights,” a feature that identifies these interesting listening moments and weaves them into a personalized narrative. This guide walks through the technical architecture behind that feature, from data ingestion to storytelling generation. By the end, you’ll understand how to build a similar system for your own music or media platform, using a combination of stream processing, feature engineering, and natural language generation.
Prerequisites
Before diving into the code, ensure you have the following background or tools ready:
- Data engineering fundamentals: familiarity with streaming pipelines (Apache Kafka, Apache Flink) and batch processing (Apache Spark).
- Machine learning basics: understanding of feature extraction, clustering, and anomaly detection.
- Programming environment: Python 3.10+ with libraries like
pandas,numpy,scikit-learn, and a SQL database (e.g., PostgreSQL). - A sample dataset: at least 1 million listening events with fields:
user_id,track_id,artist_id,timestamp,duration_ms,context(e.g., playlist, radio, search). - Access to a cloud platform (optional) for scalable processing, though local development works for smaller datasets.
Step‑by‑Step Instructions
1. Data Ingestion and Cleaning
The first step is to collect and normalize raw streaming events. Spotify processes billions of events daily, but for a Wrapped‑style analysis you only need the previous year’s data. Use a lambda architecture: stream events into a Kafka topic for real‑time monitoring, and batch load historical data into a data lake (e.g., S3 + Parquet).
# Example: reading a CSV file with pandas
import pandas as pd

df = pd.read_csv('listening_history_2025.csv')

# Filter for valid events (positive duration, recent 12 months)
df = df[(df['duration_ms'] > 30000) & (df['timestamp'] >= '2025-01-01')]
df['date'] = pd.to_datetime(df['timestamp']).dt.date
2. Feature Engineering for Listening Moments
Interesting moments often involve patterns such as sudden repetition, cross‑genre exploration, or time‑based anomalies. Create features at the user‑day level:
- Session density: number of tracks per hour, to detect binges.
- Diversity score: entropy of artist/genre distribution.
- Discovery percentage: fraction of first‑time listens (track never heard before).
- Time of day skew: deviation from the user’s typical listening hours.
# Example: compute daily diversity score using scikit-learn
from sklearn.metrics import mutual_info_score

def artist_entropy(user_day):
    counts = user_day['artist_id'].value_counts(normalize=True)
    return -sum(counts * np.log2(counts + 1e-10))
3. Anomaly Detection for Highlight Candidates
Highlights are outliers relative to the user’s normal behavior. Train an isolation forest per user, or use a global clustering approach combined with a user baseline. A simple threshold‑based method works too: flag any day where at least two features exceed the 90th percentile of that user’s history.
from sklearn.ensemble import IsolationForest

# For simplicity, use a per-user quantile rule
highlights = []
for user, group in df.groupby('user_id'):
    baseline = group.describe()
    for _, row in group.iterrows():
        flags = 0
        if row['session_density'] > baseline.loc['75%', 'session_density']:
            flags += 1
        if row['discovery_pct'] > baseline.loc['90%', 'discovery_pct']:
            flags += 1
        # ... more rules
        if flags >= 2:
            highlights.append(row.to_dict())
4. Storytelling with Templates
Once you have candidate moments, cluster them into narrative types: “First Love” (discovery of a new favorite), “Deep Dive” (obsessive repeat listening), “Late Night Session”, etc. Use a rule‑based template engine or a small LLM (e.g., GPT‑2 fine‑tuned on past Wrapped stories) to generate a sentence. Example template:

templates = {
    'first_love': "You first discovered {artist} on {date} and then listened {count} times in the next week.",
    'deep_dive': "On {date}, you played {track} {plays} times in one day — your most replayed track ever.",
}
For each highlight, select the best matching template and fill the placeholders. To avoid repetition, add a diversity ranking that prioritizes different artists and time periods.
5. Personalization and Ranking
Not all highlights are equally interesting. Build a scoring function that gives weight to:
- Uniqueness: how rare is the pattern across all users?
- Emotional impact: proxy via skipped‑rate (low skip‑rate indicates positive engagement).
- Recency: moments from later in the year feel more relevant.
def highlight_score(row, global_stats):
    rarity = 1 - (row['pattern_count'] / global_stats['total_users'])
    engagement = 1 - row['skip_rate']
    recency = (row['date'] - start_of_year).days / 365
    return 0.5 * rarity + 0.3 * engagement + 0.2 * recency
Select the top 3–5 highlights per user. Store these in a database for fast retrieval during the Wrapped viewing experience.
Common Mistakes and How to Avoid Them
Overfitting to Noise
Using overly sensitive anomaly thresholds can flag random spikes as “highlights.” Always validate against a hold‑out test set of past Wrapped feedback (e.g., user shares or likes). Use a minimum support count (e.g., the pattern appears at least twice in the user’s history).
Ignoring User Privacy
Aggregating too much personal data (e.g., exact timestamps) can raise privacy concerns. Anonymize data as early as possible, and use differential privacy when publishing aggregate statistics. Spotify, for instance, only shows highlights that cannot be traced back to a specific moment.
Template Repetition
If two highlights fall into the same template category, the story becomes boring. Implement a “diversity penalty” that lowers the score of a highlight if the previous one used the same template or artist.
Underestimating Scale
Processing a year’s worth of listening data for hundreds of millions of users requires a distributed system. Early prototypes can run locally, but production must use Spark on a cluster and shard by user to avoid memory issues.
Summary
Building a system like Spotify’s 2025 Wrapped Highlights involves collecting cleaned listening events, engineering features that capture behavioral outliers, detecting anomalous moments, generating natural language stories from templates, and ranking those stories for personalization. The approach described here balances simplicity with scalability, using off‑the‑shelf libraries and clear business rules. By following these steps and avoiding common pitfalls like overfitting or privacy leaks, you can create compelling, personalized musical retrospectives for any platform. The key is to remember that the best highlights are not just statistical anomalies—they are moments that users themselves would remember and want to share.
Related Articles
- Spotify Launches Verified Badge to Fight AI Impersonation in Music
- Apple Slashes Prices: Record Discounts on Watch Series 11, MacBook Air M5, and AirPods Pro 3 – Here's What to Buy
- Understanding Agentic Development: Insights from Spotify and Anthropic’s Collaboration
- 10 Ways Agentic Development is Reshaping Software Engineering: Insights from Spotify & Anthropic
- Exploring Agentic Development: Insights from the Spotify and Anthropic Live Discussion
- Building with AI Agents: A Practical Guide Inspired by Spotify and Anthropic
- Best Apple Deals: M5 MacBook Air, iPad Air, MacBook Pro, and Apple Watch Series 11 at Record Low Prices
- 10 Revelations from the Tech Engine That Powers Your 2025 Wrapped