Master Excel Basics: 6 Quick Projects for Beginners (Under 1 Hour)
Welcome to the world of Excel, where a blank grid can feel overwhelming. But think of it as a versatile toolbox, not a test. By diving into practical, bite-sized projects, you'll learn essential skills while creating real-world trackers and planners. The best part? Each of these projects can be completed in under an hour, making them perfect for busy beginners. Below, you'll find a step-by-step Q&A guide to get you started. Use the links to jump to any question.
- What makes Excel projects ideal for beginners?
- Which core Excel skills will I learn from these projects?
- How can I create a simple budget tracker in under an hour?
- What is the easiest way to build a weekly planner in Excel?
- Can I make a to-do list with automatic progress tracking?
- How do I design a personal expense tracker that highlights overspending?
What makes Excel projects ideal for beginners?
Excel projects are perfect for beginners because they transform abstract functions into tangible outcomes. Instead of memorizing formulas, you apply them immediately to something useful—like a budget or schedule. This hands-on approach builds confidence and reinforces learning. Plus, the short timeframe (under an hour) keeps frustration low and motivation high. Each project introduces a handful of key features—such as SUM functions, cell formatting, and conditional formatting—in a manageable way. You see immediate results, which helps you understand why a tool works, not just how to copy it. Over time, these small wins compound, turning you into a competent Excel user without the usual drudgery.
Which core Excel skills will I learn from these projects?
These projects teach four foundational skills that apply to almost any spreadsheet task: data entry and organization (structuring lists, using headers), basic formulas (SUM, AVERAGE, IF), formatting (borders, colors, number formats), and conditional formatting (automatic highlights based on rules). You'll also get comfortable with features like AutoFill (quickly copying formulas across cells) and freeze panes (keeping headers visible while scrolling). By the end of the hour, you'll have a solid grasp of how to turn raw data into clear, actionable information. These skills are the building blocks for more advanced work like charts, pivot tables, and macros.
How can I create a simple budget tracker in under an hour?
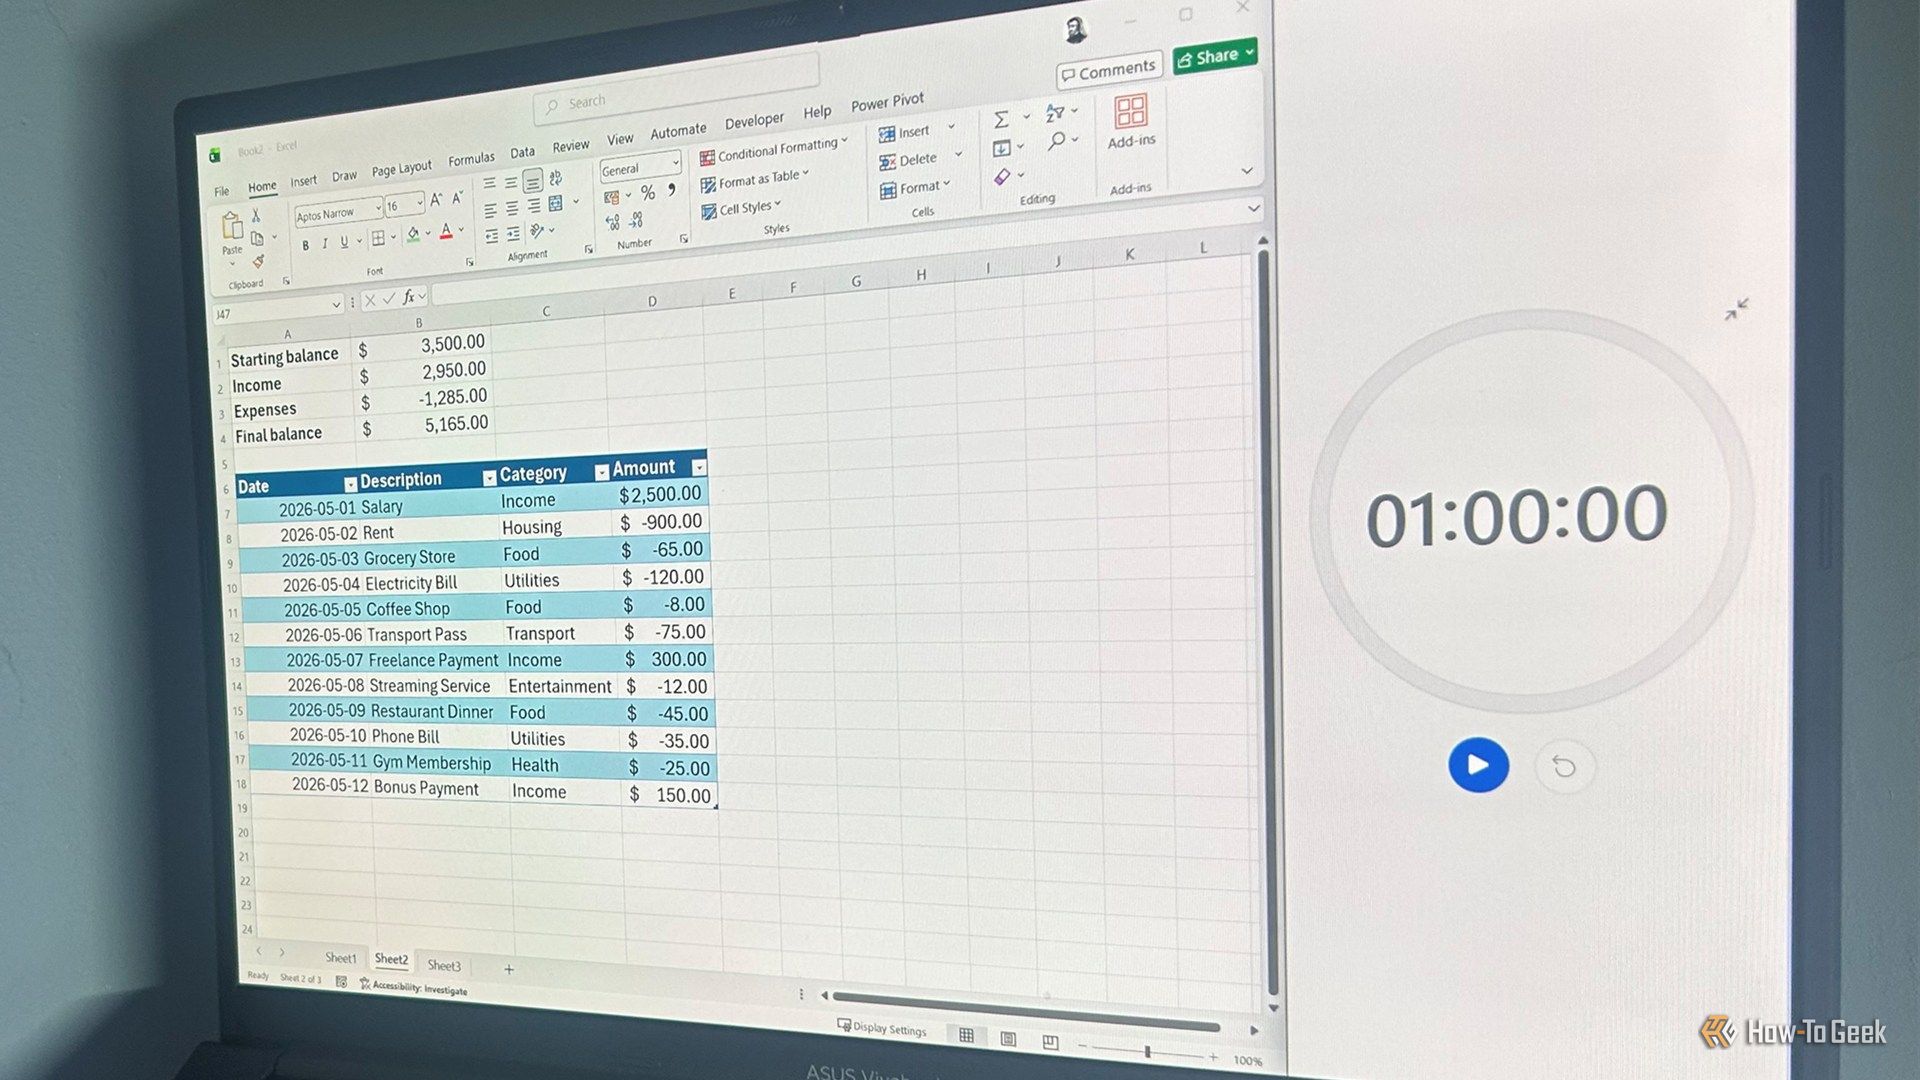
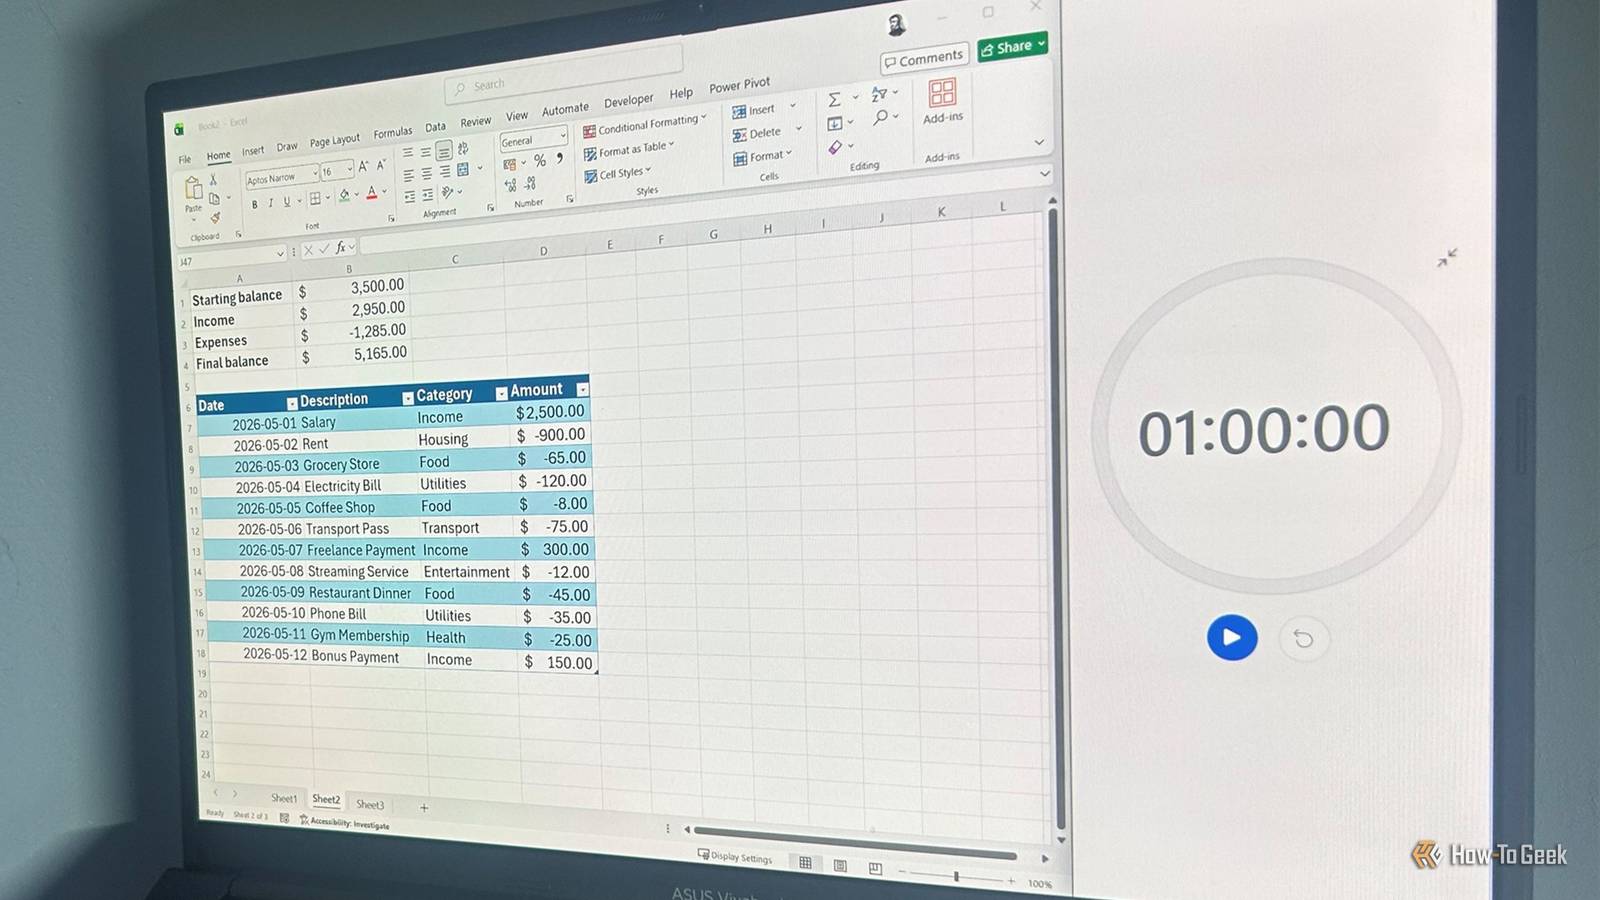
Start by listing your income and expense categories in column A (e.g., Salary, Rent, Groceries). In column B, enter the planned amounts. In column C, enter what you actually spend. Then use the SUM formula to total each column. Add a fourth column for the difference: =B2-C2 and copy it down. Apply conditional formatting to highlight any negative differences in red—these are overspent areas. Finally, add a row at the bottom with totals using SUM. For a polished look, use borders and bold headers. This project teaches you formulas, cell references, and formatting in less than 60 minutes.
What is the easiest way to build a weekly planner in Excel?
Create a grid with days of the week as columns (Monday to Sunday) and time slots (e.g., 8:00 AM, 9:00 AM) as rows. Use Merge & Center to make the title row across the top. For each cell, you can type activities or use data validation to create dropdown lists (e.g., Work, Exercise, Meal). To make it visual, use Fill Color to color-code different activity types. Add a section below for notes or goals. The key skill here is mastering alignment, merging, and basic layout—all while building a tool you'll actually use. You can finish this in 30 minutes if you skip dropdowns, or the full hour if you add the data validation.
Can I make a to-do list with automatic progress tracking?
Absolutely. In column A, list your tasks. In column B, add a checkbox (via the Developer tab or Insert > Form Controls). For each checked item, you can use a formula like =IF(B2=TRUE,1,0) in column C to count completed tasks. Below the list, use =SUM(C:C) to get total completed, and =COUNTA(A:A) for total tasks. Then display progress as a percentage: =SUM(C:C)/COUNTA(A:A) and format it as %. To make it even cooler, apply conditional formatting to strikethrough and gray out completed tasks. This project teaches logical functions (IF), checkboxes, and dynamic percentages—all in under an hour.
How do I design a personal expense tracker that highlights overspending?
List your expense categories (e.g., Food, Transport, Entertainment). Enter your budget in column B, then actual spending in column C. Use the IF function in column D: =IF(C2>B2, "Over budget", "On track"). Then apply conditional formatting with a red fill for any cell in column C that exceeds its budget. Add a total row with SUM for both budget and actual. For extra insights, create a pivot table (optional, if time allows) to see totals by category. This project reinforces IF statements, comparison logic, and visual alerts. It's a real-world tool that helps you manage your money while mastering Excel.
Related Articles
- Bridging the AI Governance Gap: From Policy to Operational Readiness
- The Troubling Reversal: 10 Facts About the Growing Gender Gap in Math Worldwide
- Kuaishou's SRPO Cuts Training Steps by 90% While Matching DeepSeek-R1-Zero Reasoning Performance
- Your First macOS Apps: A Comprehensive Tutorial Series for Swift Beginners
- 10 Ways Kazakhstan’s Renewed Coursera Partnership Is Transforming Higher Education
- How to Accelerate NetSuite Customizations Using SuiteCloud Agent Skills with AI Coding Assistants
- Merged Powerhouse: Coursera and Udemy Join Forces to Create Premier Skills Ecosystem
- Thinking Machines Breaks AI's Turn-Based Mold with Real-Time Voice and Video Interaction Models